
PostgreSQL is the world's most trusted relational database. However, as applications scale past 10 million rows and enter high-concurrency environments—processing thousands of concurrent reads and writes per second—standard database architectures begin to degrade under the weight of lock contention, disk I/O bottlenecks, and index bloat.
When queries slow down, the instinctive reaction of many engineering teams is to add another B-Tree index. This common mistake triggers Write Amplification: for every row inserted or updated, PostgreSQL must update not only the table heap (unless a HOT update occurs) but every single associated index on disk.
In PostgreSQL 17 and 18, database concurrency engineering requires a sophisticated understanding of modern index types: BRIN (Block Range Indexes) for append-only time-series data, GIN (Generalized Inverted Indexes) for unstructured JSONB documents, and Partial Indexes for high-frequency status queues.
In this deep-dive engineering guide, we break down indexing mechanics, autovacuum tuning strategies, and connection pooling architectures required to scale PostgreSQL to tens of millions of rows with sub-10ms query latencies.
1. The Under-The-Hood Reality: B-Tree vs. BRIN Indexes
A standard PostgreSQL B-Tree index maintains a balanced tree structure where every individual row in the table has a corresponding pointer (ItemPointerData or TID) containing the disk block number and offset. While B-Trees provide instantaneous O(log N) point lookups, their memory footprint scales linearly with row count.
Consider a table with 50 million rows tracking API requests or financial transactions. A B-Tree index on created_at can easily consume 1.2 GB to 2.5 GB of RAM. When your working index set exceeds your shared_buffers, PostgreSQL is forced to fetch index pages from NVMe disk, causing catastrophic read spikes.
Enter BRIN: Block Range Indexes
BRIN does not index individual rows. Instead, it inspects physical disk pages (by default, ranges of 128 disk pages) and records only the minimum and maximum value contained within that block range:
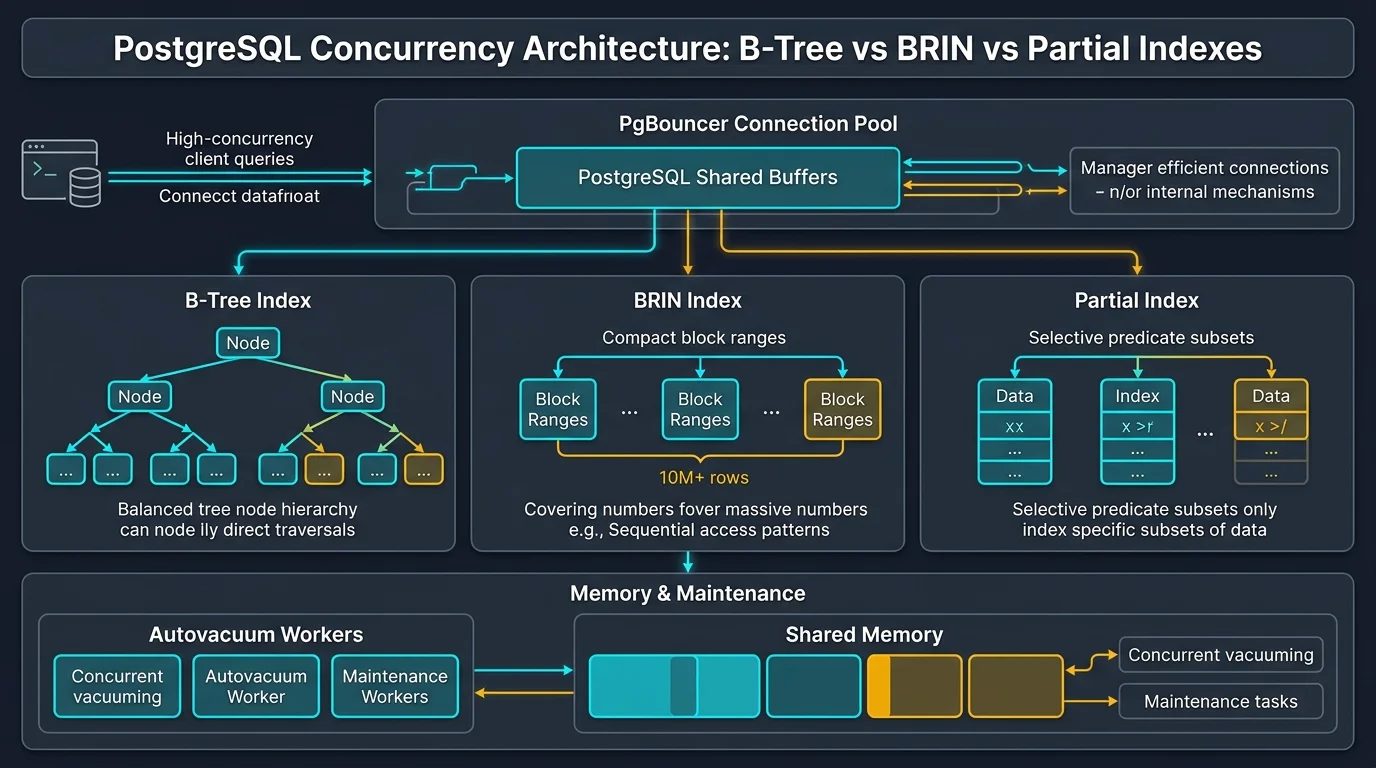
Because time-series data, auto-incrementing primary keys, and transaction logs are naturally inserted sequentially on disk, physical block ranges correlate directly with value ranges. Look at the staggering storage and RAM comparison for a 20-million row table:
| Index Type | Disk Storage Footprint | RAM Buffer Impact | Point Lookup Latency | Range Query Throughput |
|---|---|---|---|---|
| Standard B-Tree Index | 1,850 MB | High (Requires 2GB+ cache) | < 2 ms | Fast (High I/O on large scans) |
| BRIN Index (128 pages) | 320 KB (99.9% smaller!) | Negligible (< 1 MB cache) | 4 - 8 ms | Extremely High (Block skipping) |
| Partial B-Tree Index | 85 MB (95% smaller) | Minimal | < 1 ms | Instantaneous for filtered set |
-- Creating a high-performance BRIN index on 50M+ row events table
CREATE INDEX idx_audit_logs_created_at_brin
ON audit_logs
USING brin (created_at)
WITH (pages_per_range = 64);2. The Power of Partial Indexes: Cutting Queue Latency by 90%
In high-throughput microservices, background job queues and order fulfillment tables frequently suffer from index degradation. Consider an orders table with 10 million completed orders and only 5,000 pending orders currently awaiting fulfillment.
Indexing status with a standard B-Tree indexes all 10 million completed records, bloating the tree with unneeded pointers. Instead, define a Partial Index with an explicit WHERE predicate:
-- Indexes ONLY the active working set (5,000 rows instead of 10,000,000)
CREATE INDEX idx_orders_pending_fulfillment
ON orders (created_at ASC)
WHERE status = 'pending';
When workers query SELECT * FROM orders WHERE status = 'pending' ORDER BY created_at LIMIT 50, PostgreSQL traverses a tiny, in-memory index taking mere microseconds, while completely ignoring the millions of historical completed orders.
3. Indexing JSONB at Scale: GIN with jsonb_path_ops
Modern applications frequently store flexible event payloads, dynamic configuration attributes, and telemetry logs inside PostgreSQL JSONB columns. By default, developers create standard GIN indexes using CREATE INDEX ... USING gin (metadata);.
Standard GIN indexes every key and value separately, consuming substantial disk space. For queries that search for exact key-value pairs using the @> containment operator (e.g. WHERE metadata @> '{"status": "active"}'), specifying the jsonb_path_ops operator class produces an index that is 40% to 60% smaller and twice as fast:
-- High-performance compact GIN index for JSONB containment queries
CREATE INDEX idx_events_metadata_path_ops
ON event_streams
USING gin (metadata jsonb_path_ops);
4. Taming Autovacuum for High-Write Concurrency
PostgreSQL uses Multi-Version Concurrency Control (MVCC). When an UPDATE or DELETE executes, old row versions (dead tuples) remain on disk until vacuumed. In default PostgreSQL configurations, autovacuum triggers only when 20% of the table's rows are modified (autovacuum_vacuum_scale_factor = 0.2).
On a table with 10 million rows, autovacuum will not run until 2,000,000 rows have been updated! By that point, table bloat causes extreme page churn and freezes queries.
For high-concurrency tables, tune autovacuum parameters at the table level to clean dead tuples continuously in small, low-impact batches:
-- Aggressive autovacuum tuning for high-write tables
ALTER TABLE active_transactions SET (
  autovacuum_vacuum_scale_factor = 0.02,     -- Trigger at 2% modifications
  autovacuum_vacuum_threshold = 5000,        -- Minimum 5,000 dead tuples
  autovacuum_vacuum_cost_limit = 2000,       -- Double I/O budget for vacuum worker
  autovacuum_vacuum_cost_delay = 2           -- Reduce sleep between vacuum cycles (ms)
);
5. Solving Connection Exhaustion with PgBouncer Transaction Pooling
Each PostgreSQL client connection forks a dedicated operating system process consuming 5MB to 10MB of memory and competing for CPU scheduler time. Exceeding 200–300 direct database connections causes catastrophic CPU thrashing.
Deploy PgBouncer in pool_mode = transaction. Instead of binding one database connection per client application, thousands of serverless or API workers share a tight pool of 20–40 persistent database connections:
[databases]
production_db = host=127.0.0.1 port=5432 dbname=production_db

[pgbouncer]
listen_port = 6432
listen_addr = 0.0.0.0
auth_type = scram-sha-256
auth_file = /etc/pgbouncer/userlist.txt
pool_mode = transaction
max_client_conn = 5000
default_pool_size = 30
reserve_pool_size = 10
6. Production PostgreSQL Optimization Checklist
- Audit existing index usage with
pg_stat_user_indexes: drop any index whereidx_scan = 0. - Replace multi-gigabyte B-Trees on append-only time-series tables with compact BRIN indexes.
- Implement partial indexes for active queues, unprocessed webhooks, and soft-deleted rows.
- Use
jsonb_path_opsfor GIN indexes on semi-structured JSONB payloads to cut index size in half. - Lower
autovacuum_vacuum_scale_factorfrom 0.2 to 0.02 on high-write operational tables. - Place PgBouncer in front of PostgreSQL to cap active backend connections to 2-4x available CPU cores.
- Use
EXPLAIN (ANALYZE, BUFFERS)to verify queries hit cached buffers rather than physical NVMe disk.
Frequently asked questions
Sources

Written by
Hamza Fazal
Founder, DEESU
Muhammad Hamza Fazal is the Founder of DEESU. An Android and full-stack web developer and digital marketer based in Islamabad, he founded DEESU in May 2022 and leads its engineering operations, product strategy, and client software delivery.
More from HamzaNeed help with this?